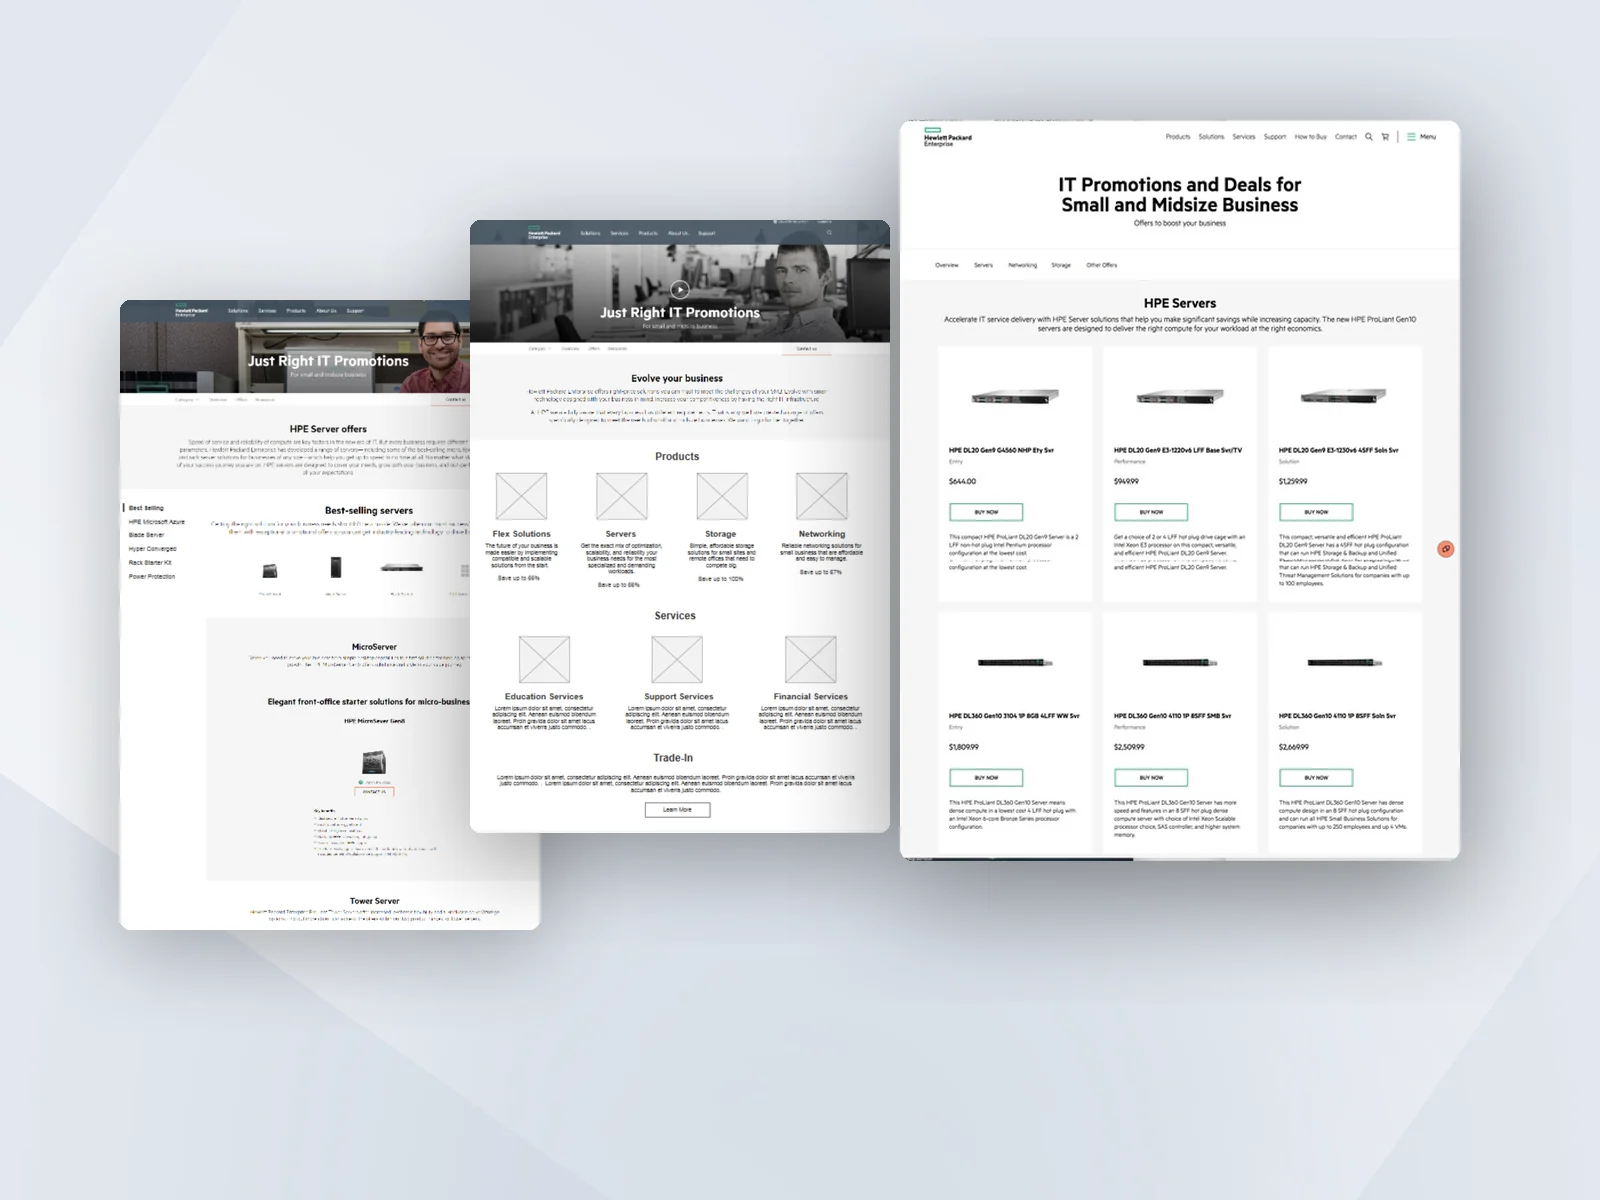
One design language for BEUSA's analytics
I set the design direction for BEUSA's three analytics tools and built the design system that ties them together.
No designer, no standards, and three analytics tools that each looked different, about to be combined in one product.
Treat them as one system. Set one dashboard standard. Make Sigma look native inside Galaxy. Hold the partner to the same standard.
Every Sigma dashboard redesigned, one design system adopted across teams and partners, and a design function where there wasn't one.
The problem
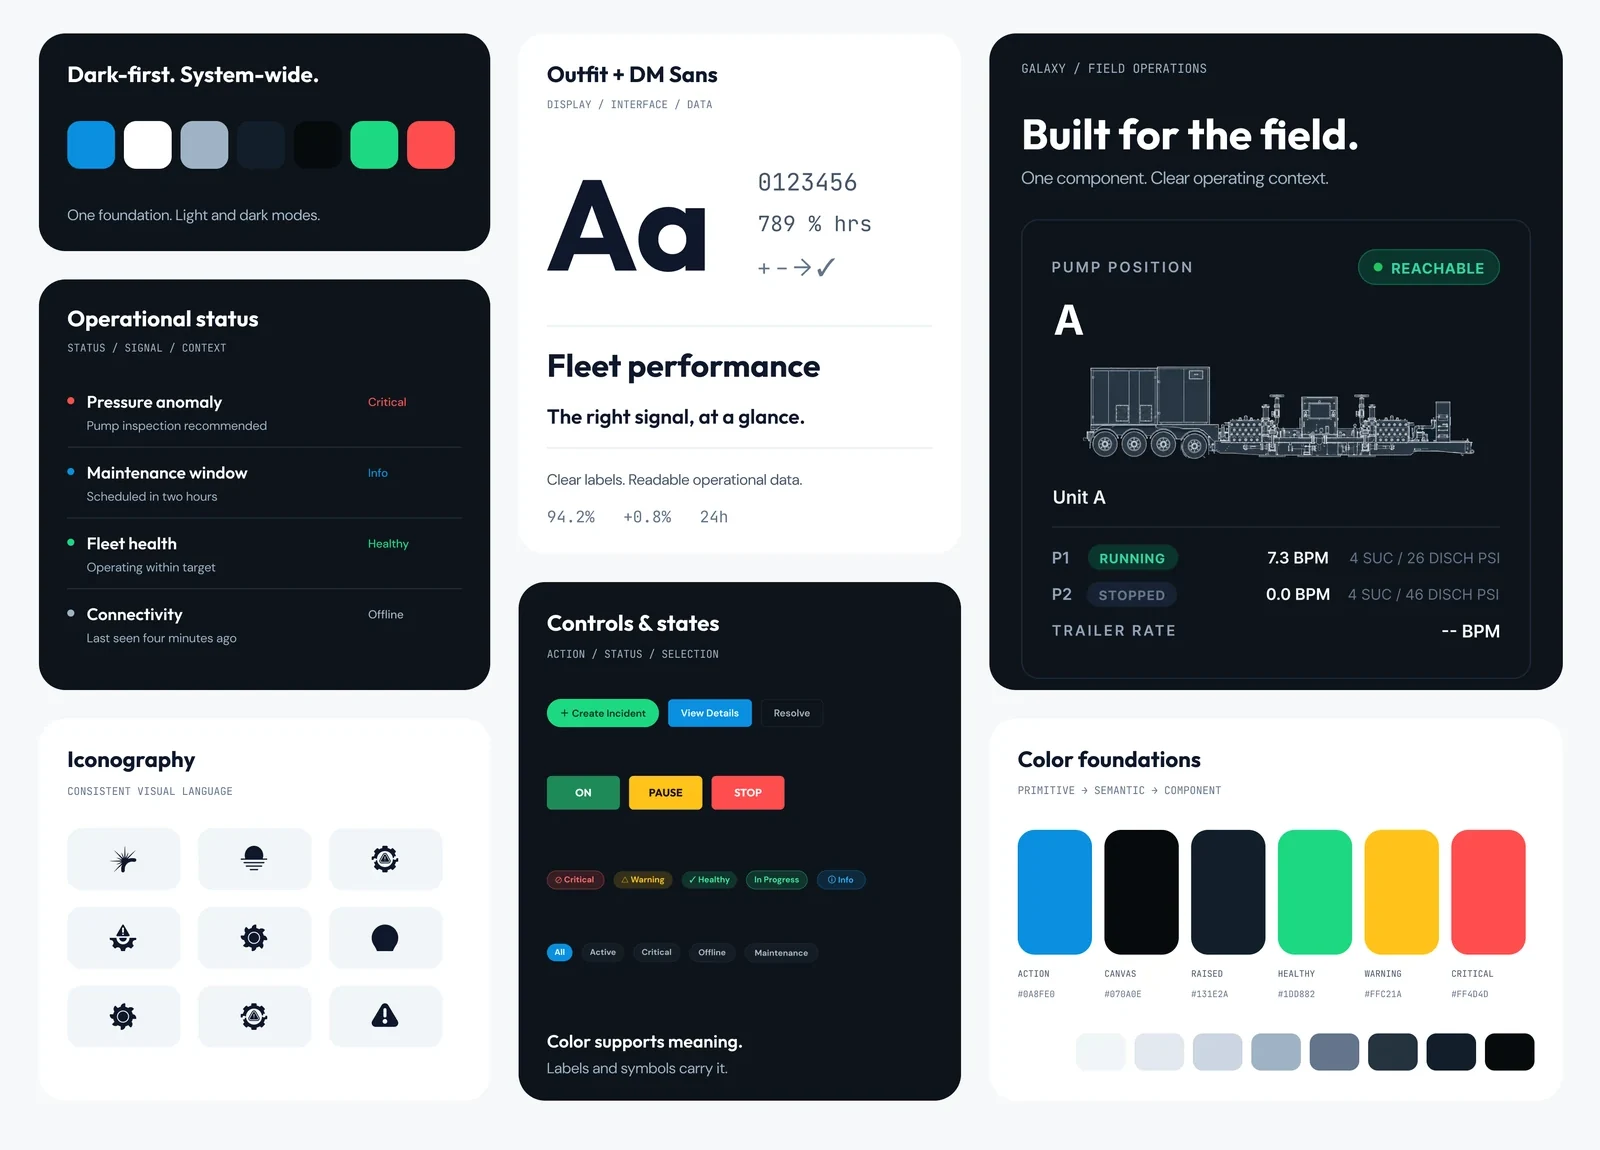
BEUSA had no designer and no design standards. Its analytics were spread across three tools that didn't look or behave alike.
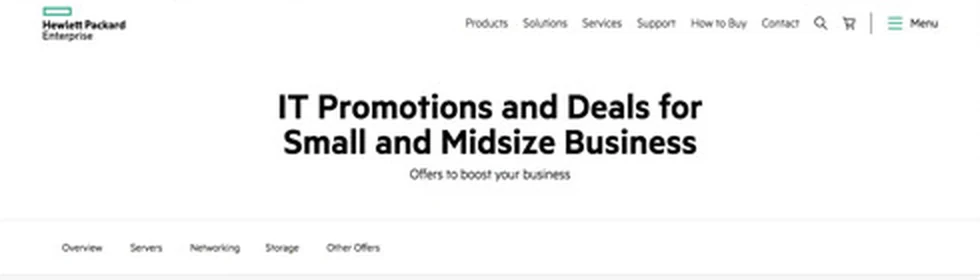
- Sigma and Grafana dashboards had each been built ad hoc, with different layouts and visual styles.
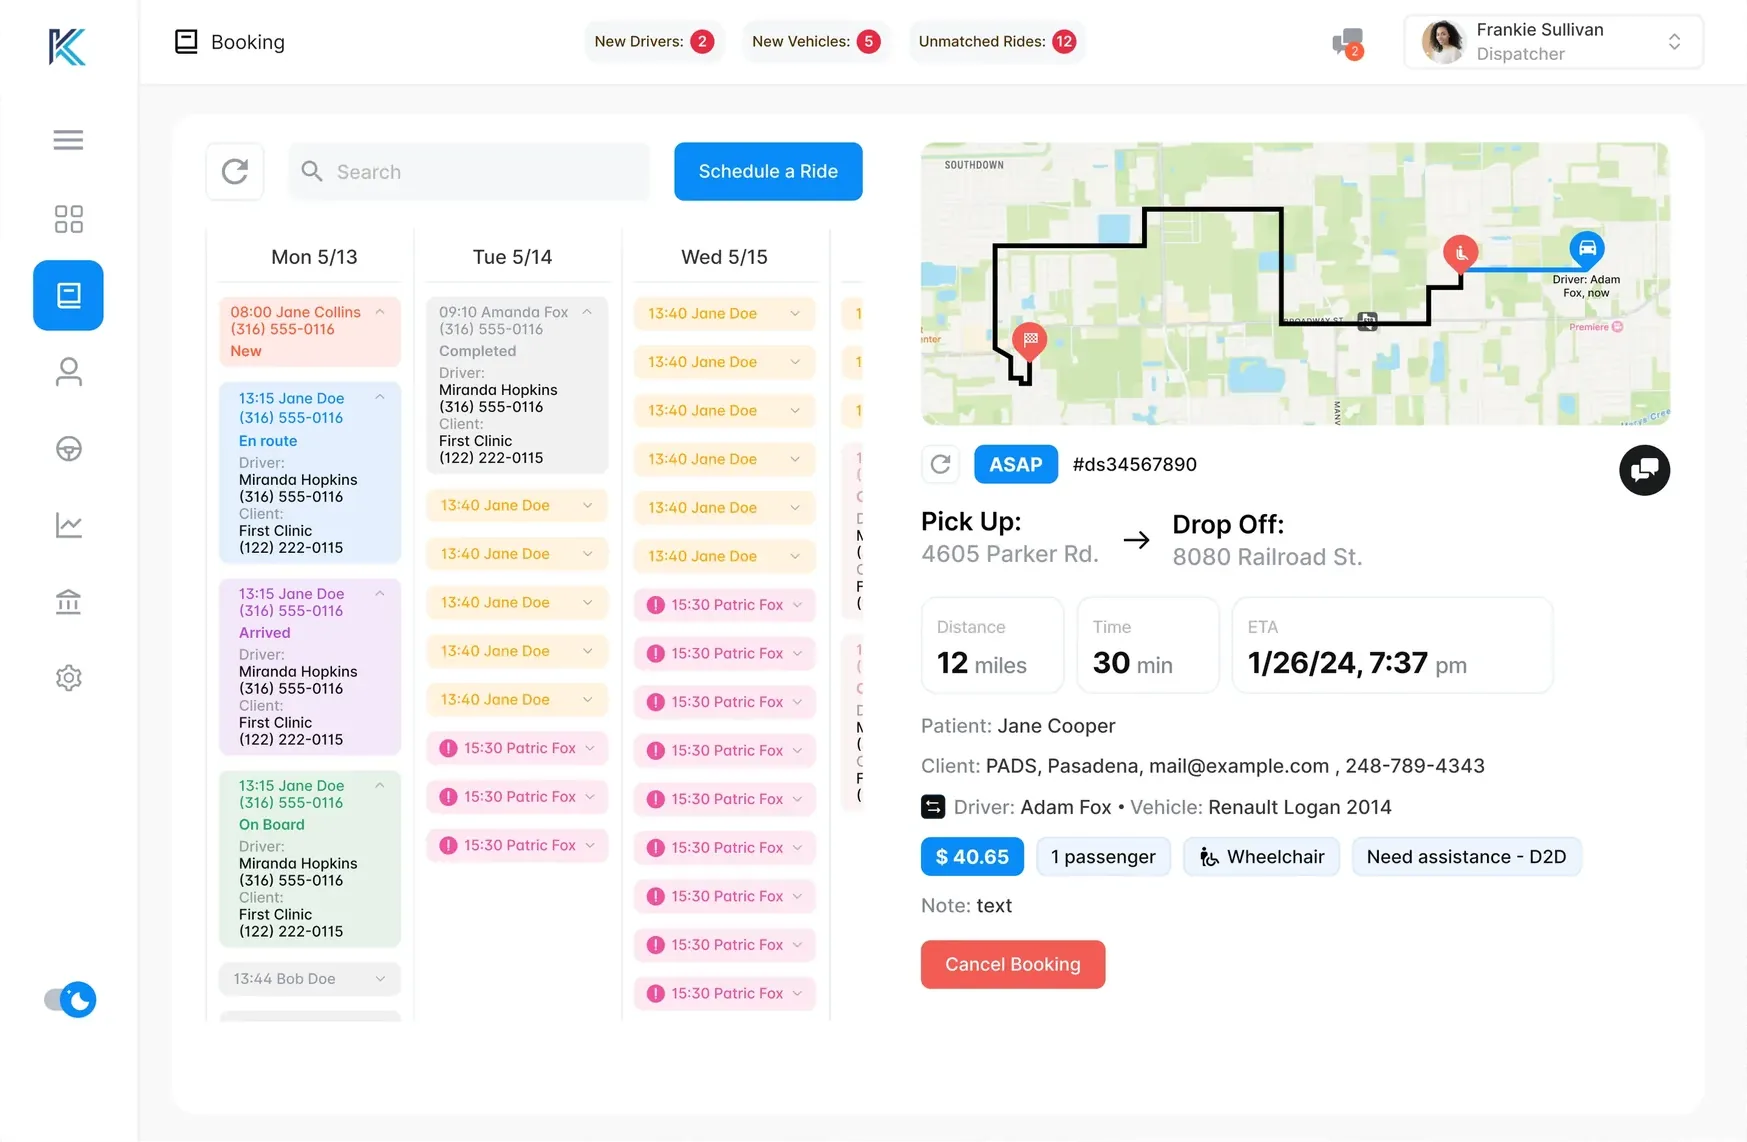
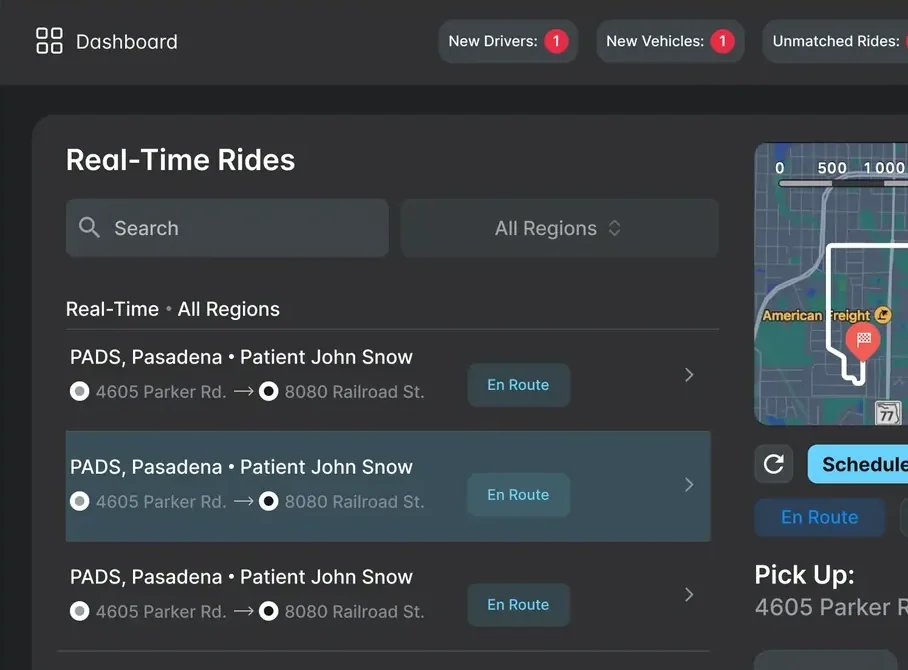
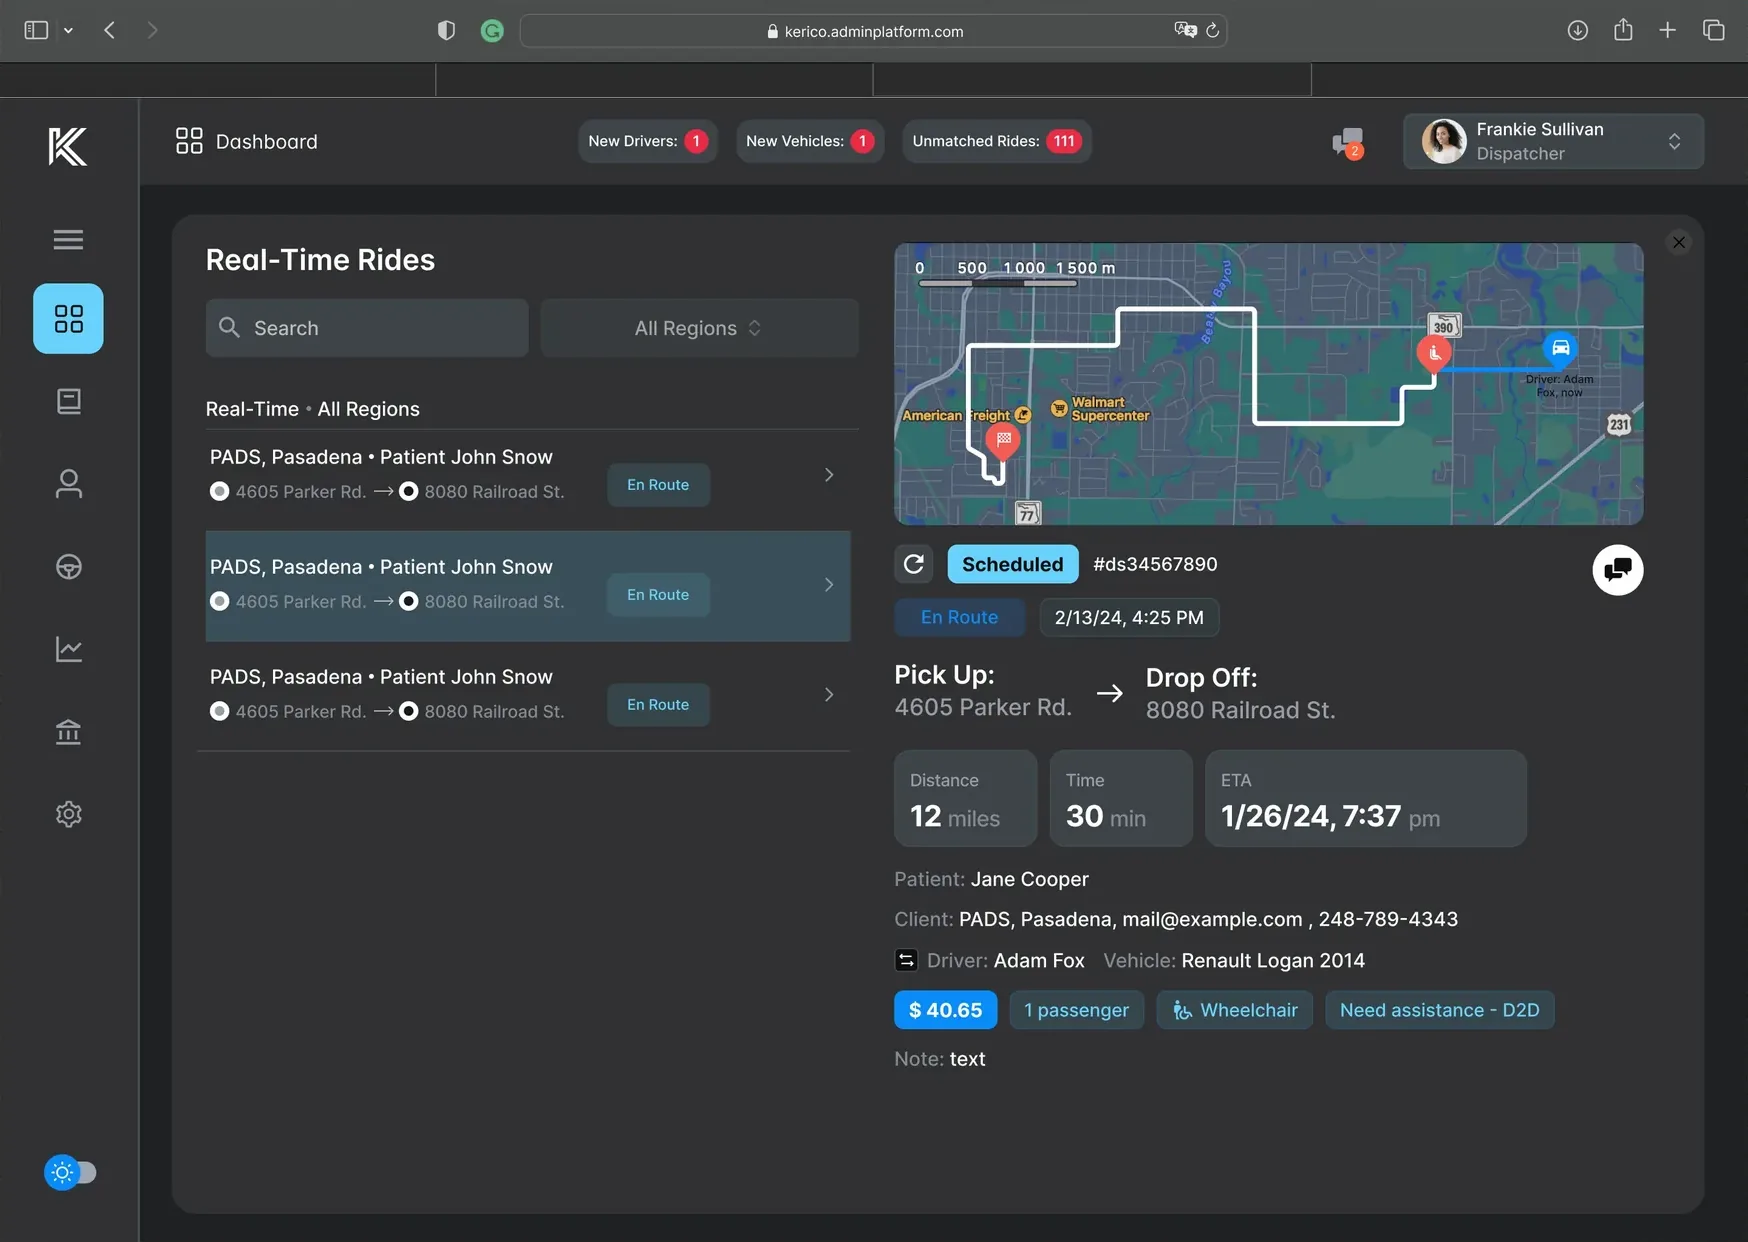
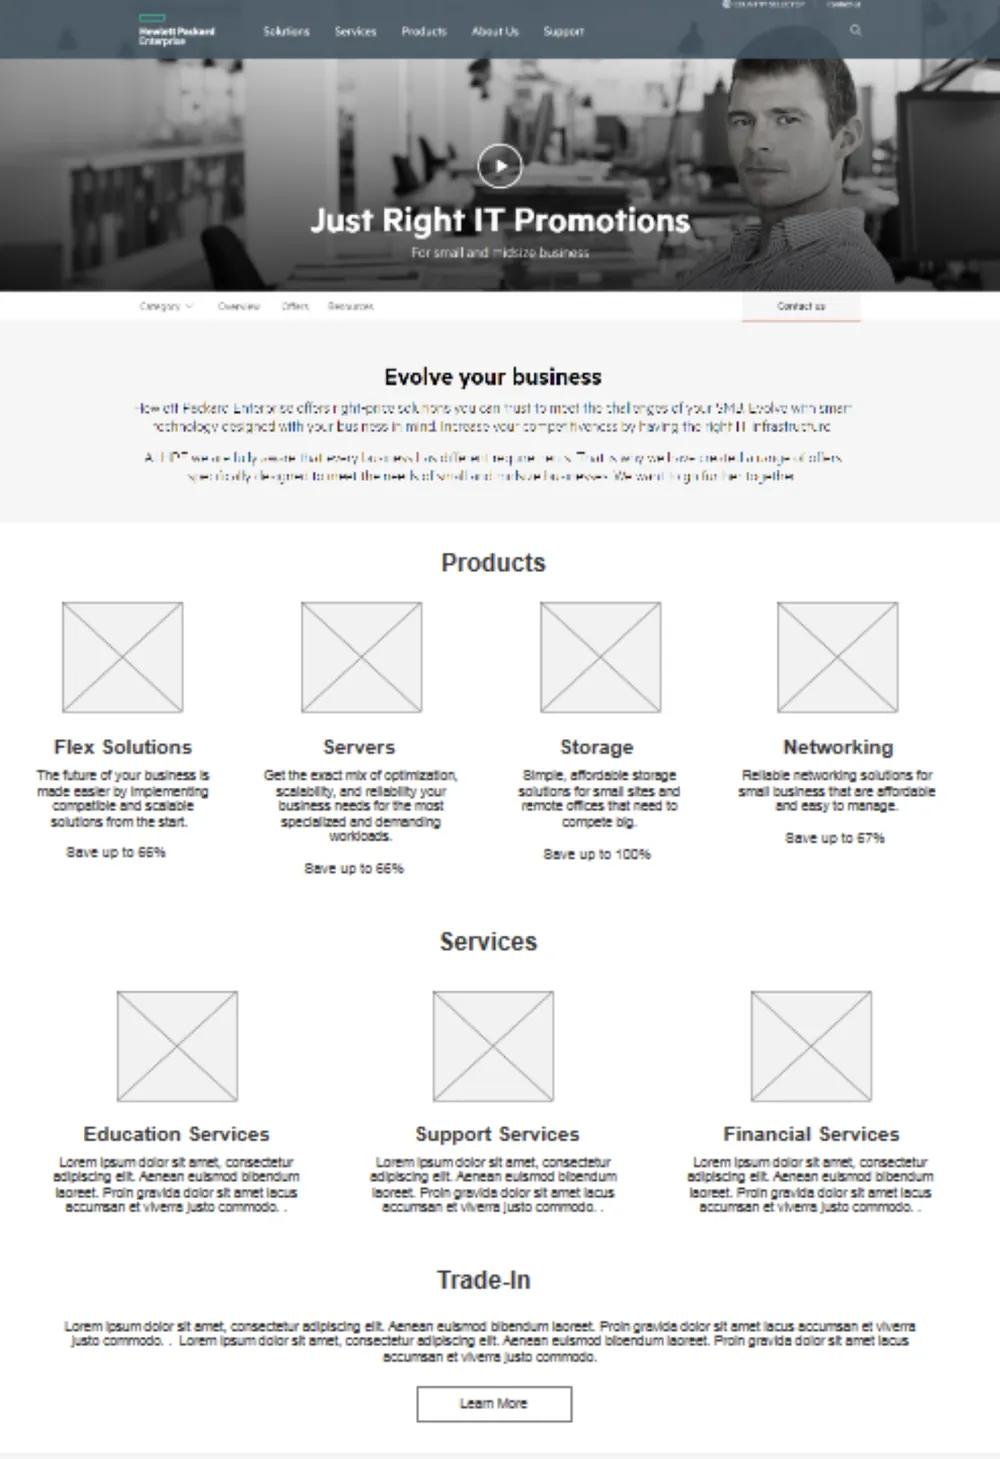
- Galaxy, a newer analytics platform built with Tavant, pulled reports from Sigma, Grafana, and other sources into one place.
- Without a shared foundation, those differences would show up side by side inside a single product, and users would keep relearning every view.
Updating dashboard UI, the work I was hired for, wouldn't fix that. The real problem was the missing system underneath.
Decision 1One system, not three tools
I saw that the gap was a missing system, so I built one design system to work across Sigma, Grafana, and Galaxy.
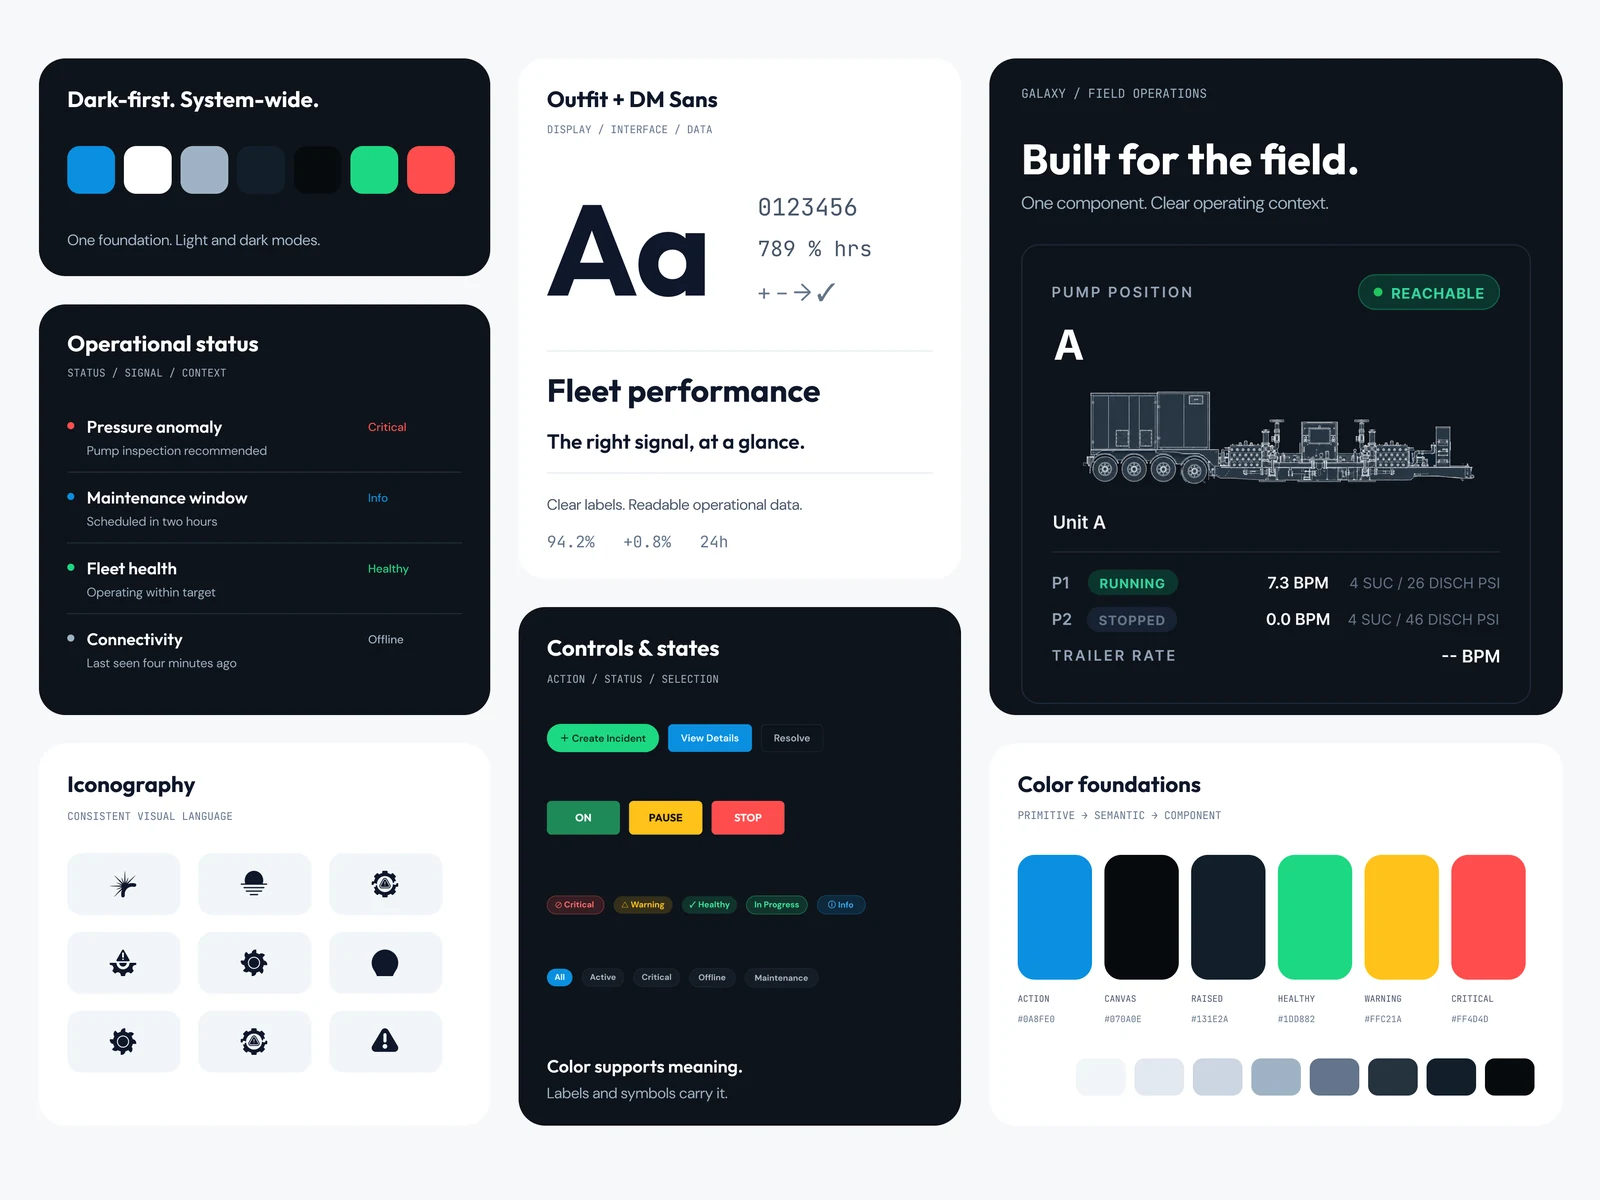
- Tokens: primitive, semantic, and component layers, with light and dark modes. A status color is defined once and means the same thing in every tool.
- Components: KPI cards, status lists, controls, and asset cards, each specified for every state.
- A Sigma design system workbook: the system rebuilt inside Sigma, so builders start from working components instead of a Figma file.
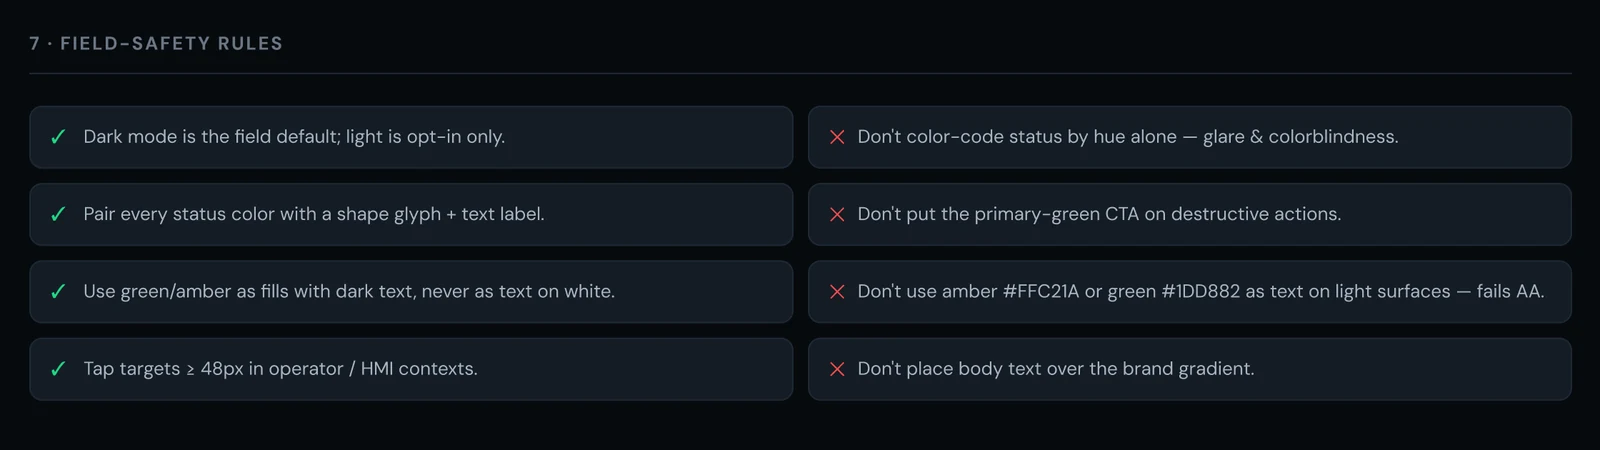
- Documentation and rules: when to use each pattern, plus field rules like "never rely on color alone."
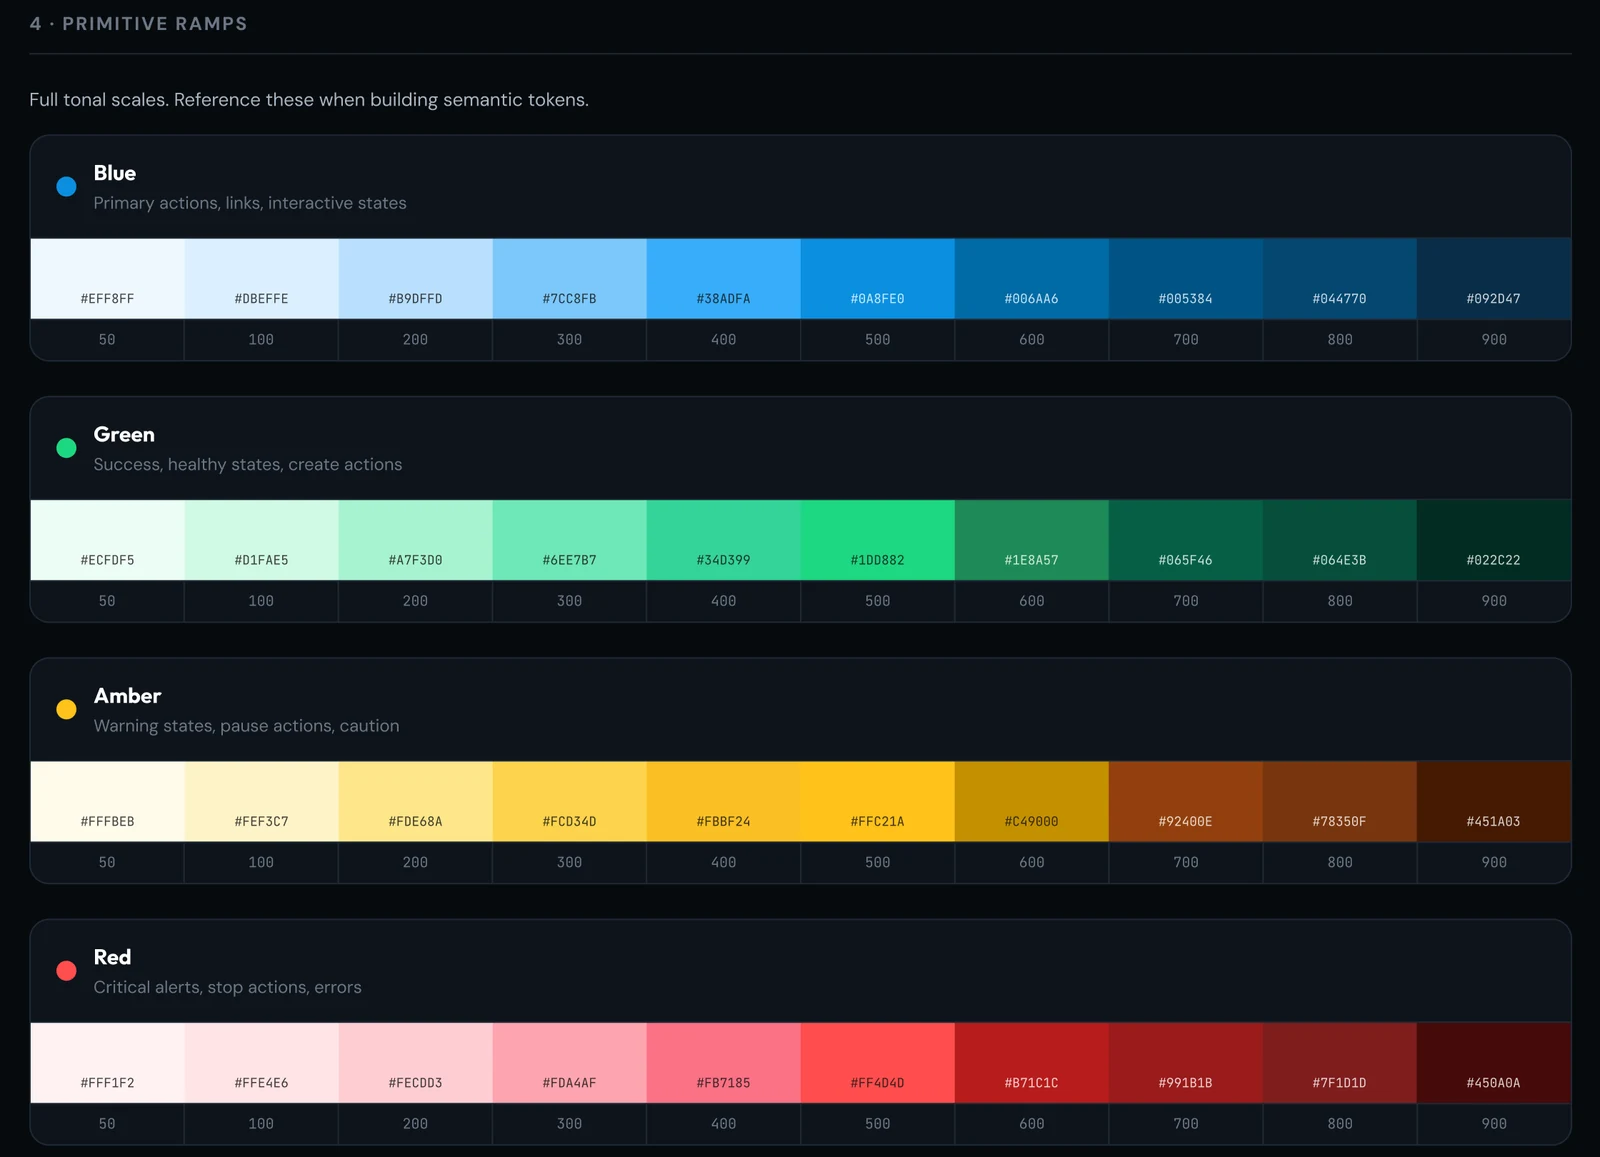
Red 500 · #FF4D4Draw value--redcritical, stopKPI card · critical stateusageDecision 2One standard for every dashboard
I redesigned every Sigma dashboard, including Performance, NPT (non-productive time), and Maintenance, to one shared structure.
Each dashboard answers the same three questions in the same order: what's happening, why, and what needs to be done. People learn the structure once and can read any dashboard.
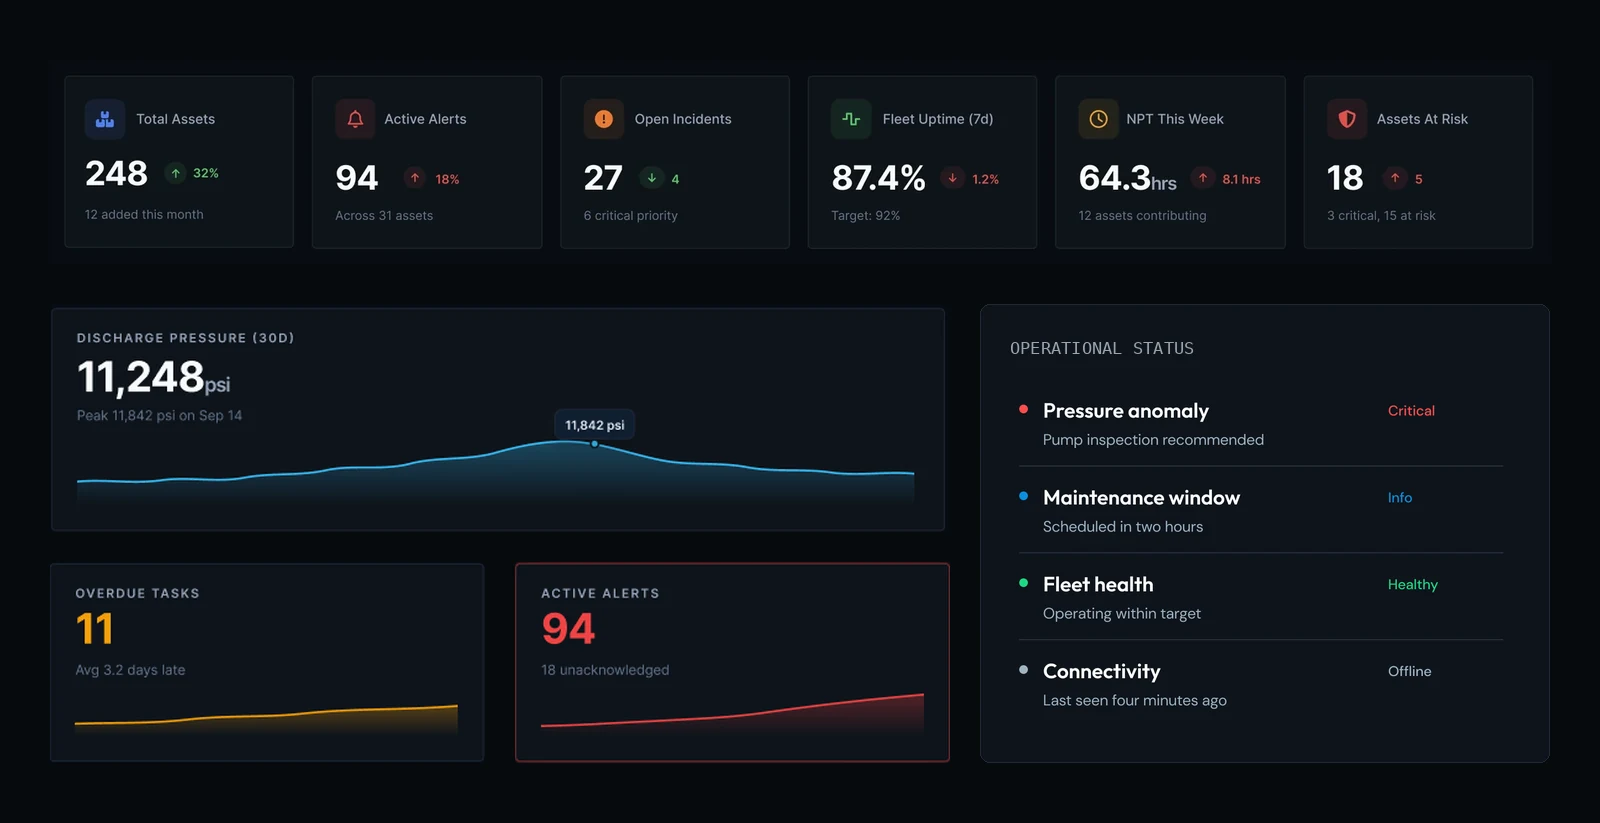
1. What's happeningKey metrics up front, readable at a glance
2. WhyTrends and detail that explain the numbers
3. What needs to be doneIssues that need action, surfaced clearly
Decision 3Make Sigma look native inside Galaxy
Galaxy's interface is card-heavy. Sigma dashboards embedded in it needed to match, or the product would look stitched together.
I tested Galaxy's layouts against what Sigma could actually do, then rebuilt them in Sigma. That surfaced techniques the development team didn't know Sigma supported:
Dense tables replaced with scannable cards that match Galaxy's layouts.
Custom-feeling structure inside a standard Sigma workbook, with no plugin required.
Embedded Sigma dashboards now read as part of Galaxy, not as a separate tool.
Decision 4Design for real operating conditions
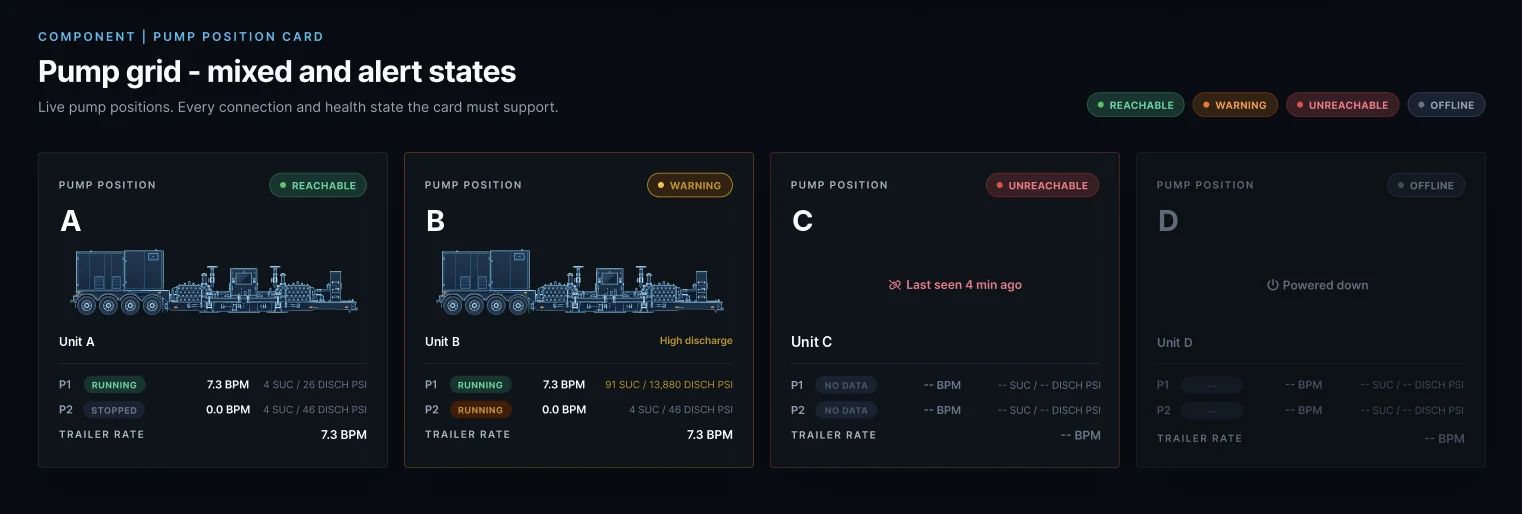
When a pump stops reporting, its card stays on screen and says so.
The pump card supports four states: reachable, warning, unreachable, and offline. When the connection drops, the card keeps its place, switches to Unreachable, replaces live values with dashes, and shows when the asset was last seen. A card that disappeared, or showed zeros, would hide the problem.
Status: designed and documented in the system. It hasn't been reviewed with field users yet; that's the next step.
Decision 5Hold the partner to the same standard
Galaxy's interface is designed by Tavant's team, so consistency depended on them too.
I audited Galaxy's interface, then set UX direction for the build, translating business priorities and user workflows into interface requirements and design standards that Tavant's designers now work to.
Decision 6Build the process, not just the screens
I'm putting in place how design work moves at BEUSA, from request to design, review, and handoff, for both the internal development team and Tavant. This part is still rolling out.
Outcomes
About six months in, as the only designer.
- Leadership now looks to me for design direction across BEUSA's analytics tools.
- Still in progress: rolling out the design process, and validating key patterns like the unreachable state with field users.